January – September 2019/2020 Comparison
In the midst of a pandemic, you’d think that real estate on an island in the middle of the Pacific Ocean would come to a grinding halt. So not true! And, closed residential sales on the Hamakua Coast takes the lead by a long shot.
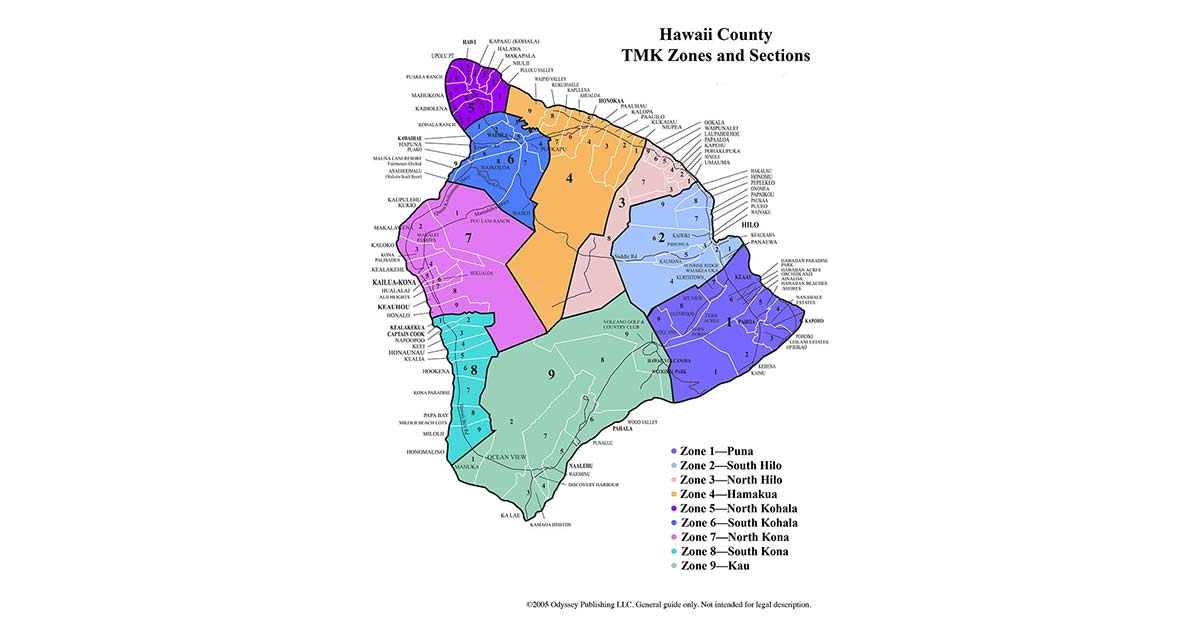
Take a look at these statistics, both island-wide and in each of our nine districts:
| Sales Volume | Median Sales | Number of Sales | |
| District 1/Puna | 10.97% | 6.72% | 5.87% |
| District 2/South Hilo | 7.74% | 4.0% | -8.09% |
| District 3/North Hilo | 29.29% | -25.29% | 31.25% |
| District 4/Hamakua | 74.13% | 22.06% | 30.00% |
| District 5/North Kohala | 11.93% | -5.56% | 7.84% |
| District 6/South Kohala | 36.72% | 8.59% | -7.35% |
| District 7/North Kona | -5.45% | 14.46% | -7.89% |
| District 8/South Kona | 59.66% | 9.03% | 13.04% |
| District 9/Kau | 33.62% | 20.10% | 13.49% |
| Island-wide | 10.93% | 3.95% | .89% |


