Maps of the Big Island

Jul 10, 2020

TMK Zones & Sections

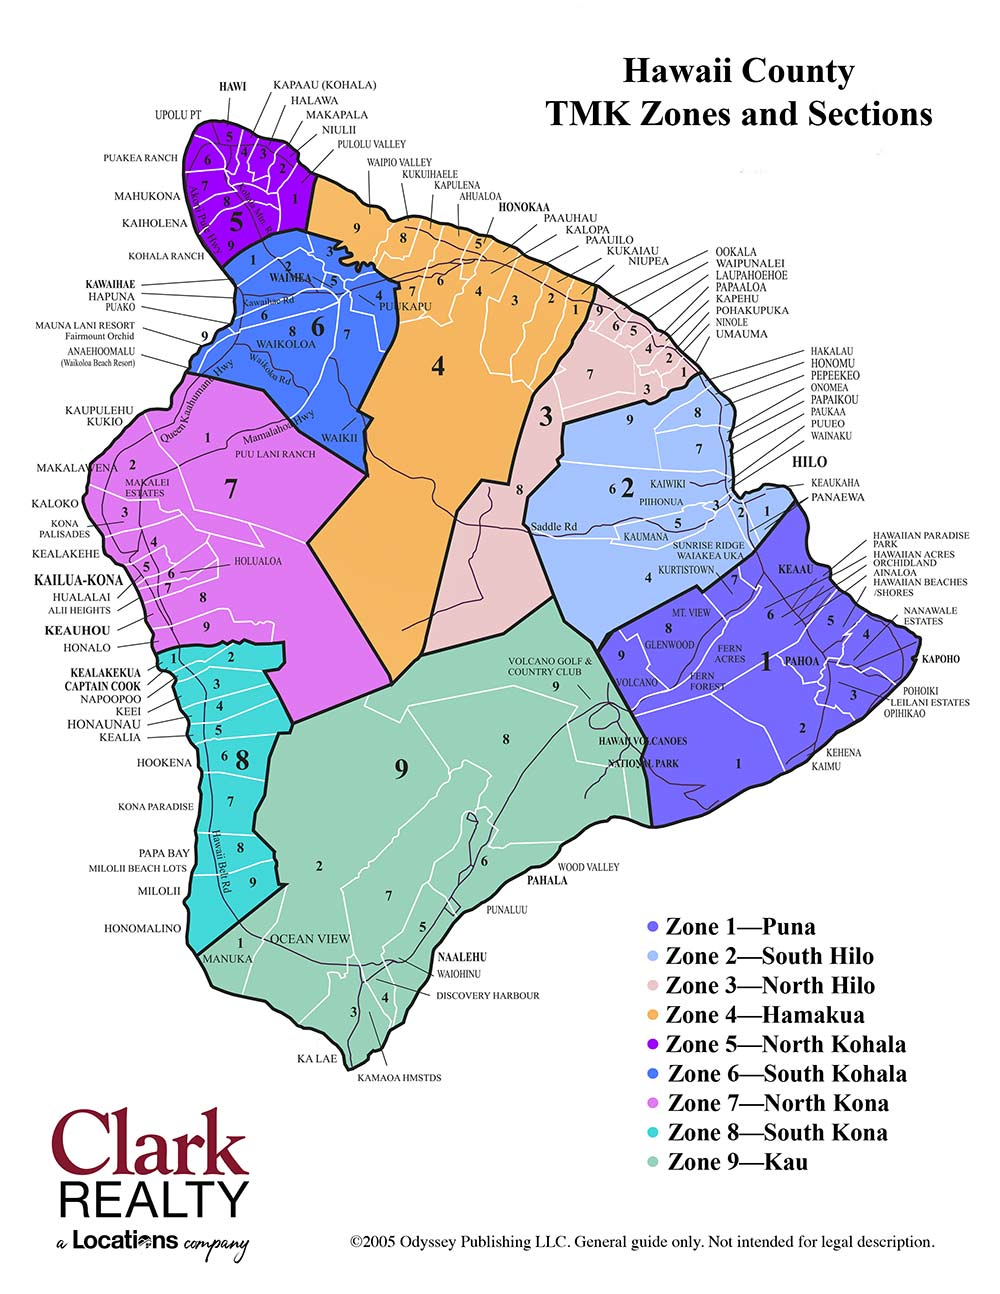
Hawaii Island TMK Zones Map

Click on the TMK Zones map to see a larger version

Of all the maps available, the TMK map, in my opinion, is the most useful in understand the Big Island. As you can see, there are nine districts, with small towns not only dotting the coast, but mauka as well. The full TMK number is included on all MLS listings and this helps you to understand where the property is located. The first number will be a “3” which notes that it is the Big Island. Then the Zone number comes next (1 – 9), then comes the smaller number you see on the map with is the section within the district. Not noted on this map, but part of the TMK will be the plat, parcel and CPR (Condominium Property Regime, if relevant.) So, a typical TMK for Paauilo looks like this:

3-4-4-(Island number, zone number, plat number)-(parcel number)-(Plus parcel number for the specific property, and CPR number, if relevant)

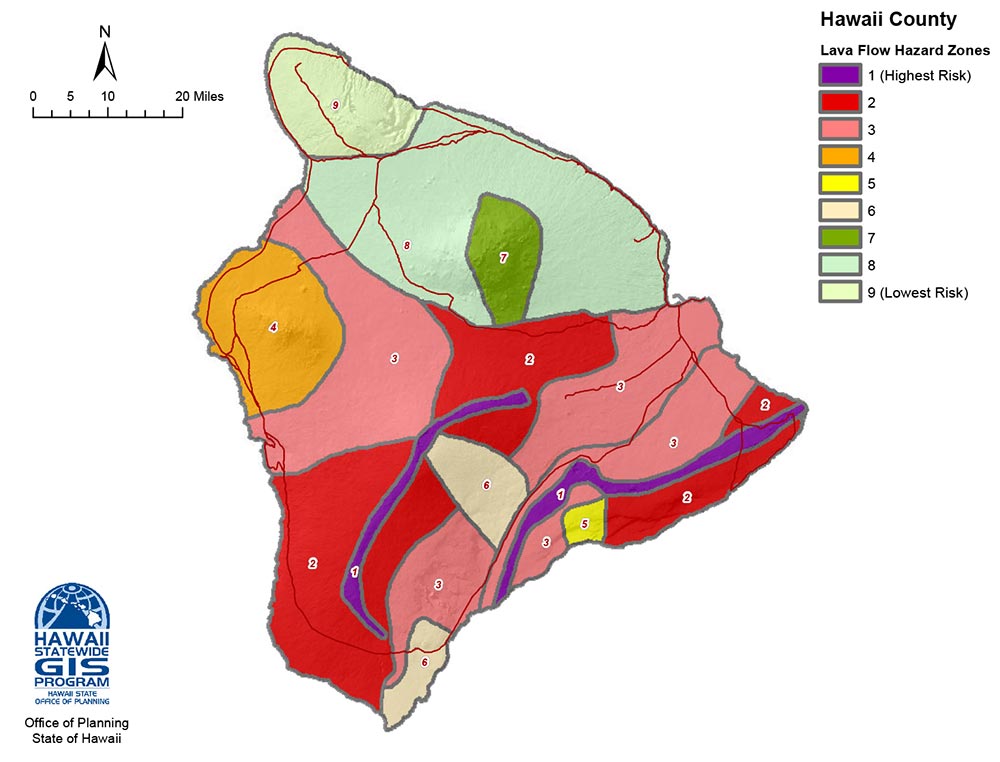
Lava hazard zone

Click on the Lava Hazard Zone map to see a larger version

This map is particularly helpful when deciding which area of the Big Island you want to live on based on the possibility of a lava flow, how it relates to property insurance as well as home values. Lava Zone 1 shows where past flows have occurred. You may not be able to get insurance in this area, and if you do it will be very expensive. As you increase in the Lava Zone numbers the potential hazard is less, insurance is more affordable, but the price of property increases. It is all a trade off. It is interesting to note that the Kona area is Lava Zone 3 and 4 depending on whether you are along the coast or mauka. During the most current eruption and the years leading up to that, the Hamakua Coast provided the cleanest air quality. This was due to typical trade wind directions.

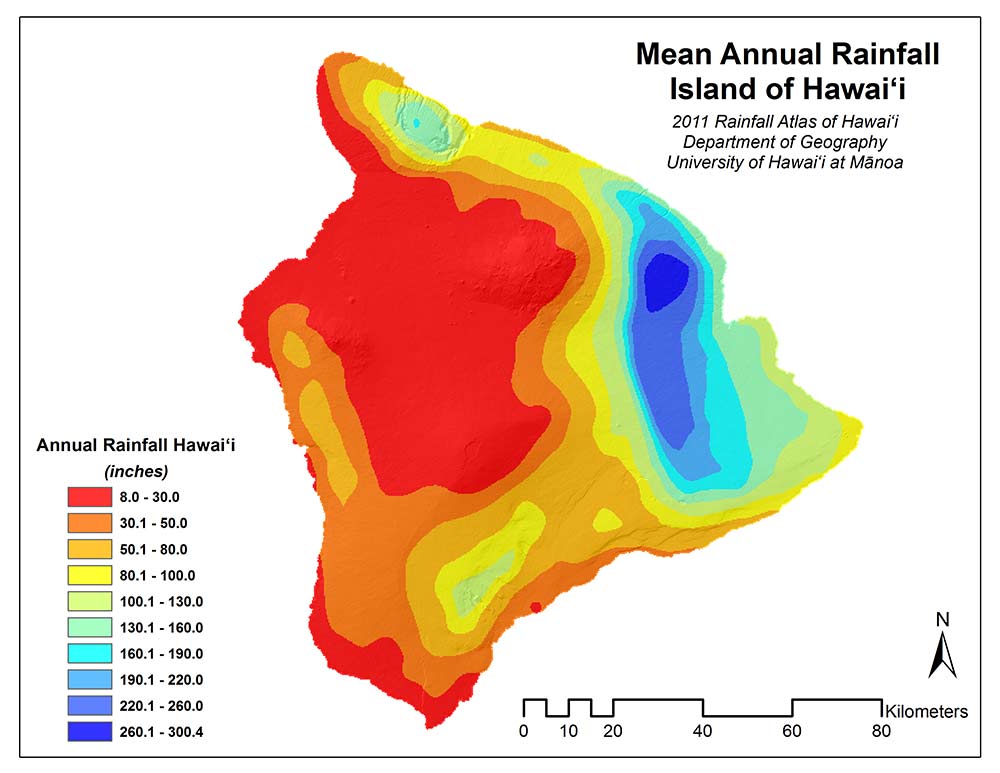
mean annual rainfall

Click on the Rainfall map to view a larger version

Giambelluca, T.W., Q. Chen, A.G. Frazier, J.P. Price, Y.-L. Chen, P.-S. Chu, J.K. Eischeid, and D.M. Delparte, 2013: Online Rainfall Atlas of Hawai‘i. Bull. Amer. Meteor. Soc. 94, 313-316, doi: 10.1175/BAMS-D-11-00228.1

This map shows you the average rainfall in inches per year throughout the Big Island. This means that we will have years or seasons with more, as well as less rain. Keep in mind that the more rain you have the more of a tropical paradise you enjoy. Less rain gives you less dirt and less productivity…more lava, warmer temperatures, more sun. Again, it is a trade off. If you want to grow crops, graze your livestock, live in a forest, you will want to live where the inches per year are higher. If surfing is your thing, sun and sand, dry/hot conditions head to the Kohala Coast and down south.

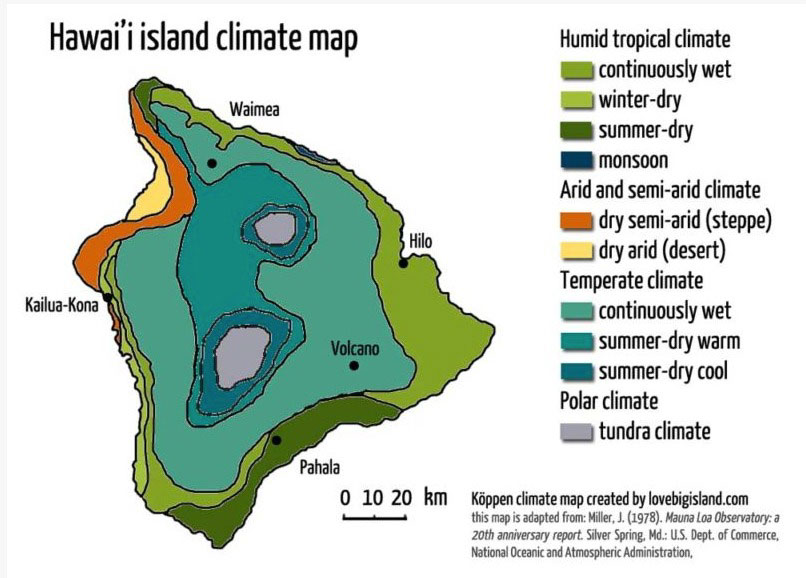
hawaii island climate map

Click on the Climate map to view a larger version

(Hawaii Island Climate Map courtesy LoveBigIsland.com)

This map shows you the micro-climates and where they are on the Big Island. Our island has the majority of all micro-climates worldwide, providing so many options when it comes to setting down your roots. One must decide if they are fine with mild or heavy trade winds, super dry or wet conditions, fog, etc. It is always best to visit an area prior to purchasing your home or land. Be sure you are comfortable with all this area has to offer in the area of climate as well as amenities. 

What Clients Are Saying

“Selling a home in this market can be so complicated, but you kept us updated at the drop of a hat whenever we had concerns. We’re so grateful for the effort you put in to keep us informed and confident while navigating this major milestone. I’ll be referring you to my friends, family, and colleagues who need real estate assistance in the future.
Thank you again for your hard work and expertise. You’re a rock star! 🤩 ”

Read Testimonials

RECENT POSTS